Just in case we don't have enough voting method simulations already, I made another one. Well, actually, I always wanted to play around with these ever since I first came across the VSE simulations of Jameson Quinn. However, due to my limited programming abilities, I didn't get far, so I put it off for the future.
But now we are living in the future where AI became good enough to write such a suite from scratch. So I just spent three weeks doing that.
Read this as a disclaimer: I'm not a programmer, it is AI written, and I spent "only" three weeks on it. So don't take it as a source of authoritative facts, but as a toy to explore general trends under the assumptions one puts into it.
I also put this out here mostly so you can poke at it and tell me what I did wrong. And of course so you can play and have some fun.
The code and results with automated and AI written analysis are available at github. Here I'll just try to give a general overview, the motivation and some insights, not looking at the results in detail.
Overview
The key motivation was to have at least two dimensions to find and visualize the Pareto Front of the good voting methods. On top of that I also wanted adaptive learned strategy to not advantage or disadvantage any methods by having to fit the best strategy to the method in question (still unavoidable in the poll naive "honest" case). This has the nice side effect that one can look at which strategies emerge on their own, per method.
The result is a simple spatial voter model with learned strategy and multiple rounds of reacting to polls. There are currently 66 voting methods (one of them as an add-on, excluding tests and references), which are evaluated on the dimensions of voter satisfaction, winning margins and sincerity of ballots. Many of the variables about the model or strategy can be changed, including strategic nomination and share of strategic voters.
For the voter distribution there are several models to choose from. One using a simple fractal noise (default), one using Gaussian clusters, one using scale-free opinion fields, and Jameson Quinn's model from vse-sim (in a version with a few changes and one as in vse-sim's code).
There is an automated analysis that puts out graphs as well as a detailed report. The reports also give more information what strategies were used to what degree and similar. All in all too much information.
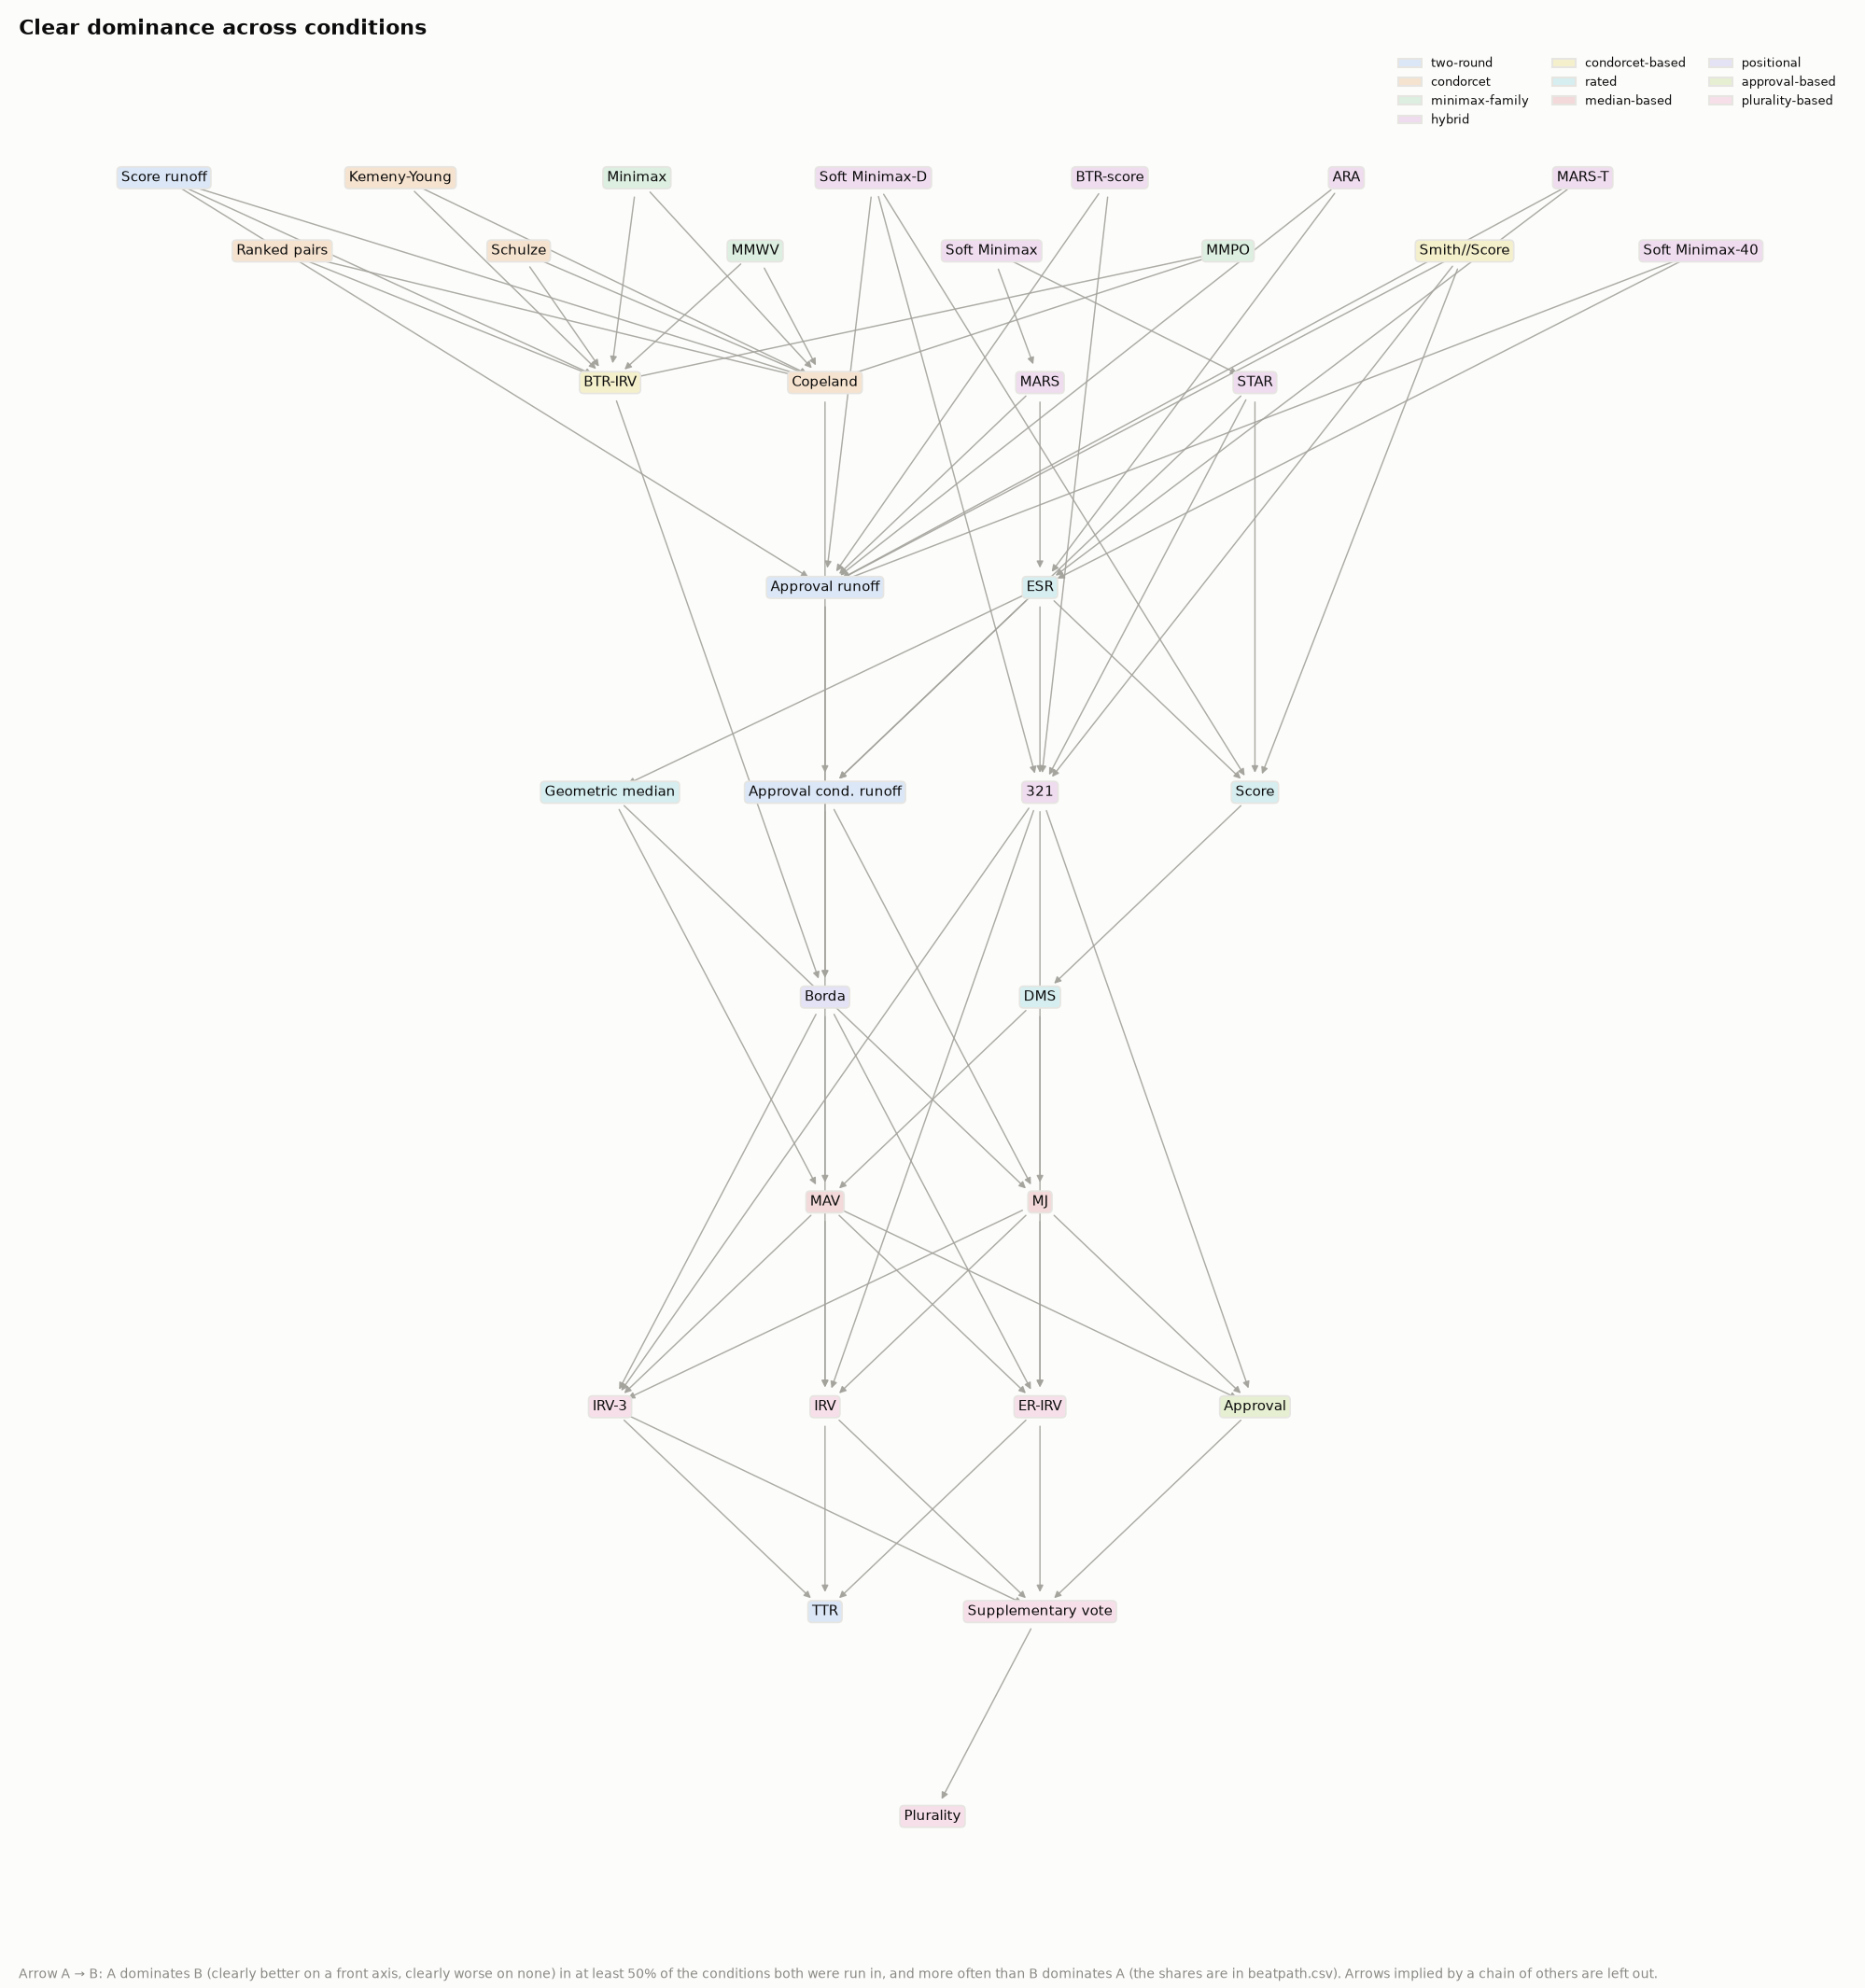
The results of several runs can be combined and compared if they use different settings, giving its own meta-report. This way one can see the effects different modeling assumptions have. It also gives a beatpath figure to illustrate which methods clearly dominate which others under several conditions.
Written in Python and with all the learning for strategy it's not very fast. A standard run with 29 voting methods 200 elections, 99 voters, 6 candidates over 3 rounds takes me under 10 minutes (time scales roughly linear when increasing these values, much faster than linear for candidates). Therefore my results have a small number of voters (99) and elections (1000 for most, 2000 for the base).
New voting methods can be added individually as addons and there is a tutorial describing how to write your own (or you can just ask an AI to do it if you don't know Python). Method definitions are short enough to share here in the comments if you like to do so. A future version might also include a simpler way to define methods, which would turn it into a one liner.
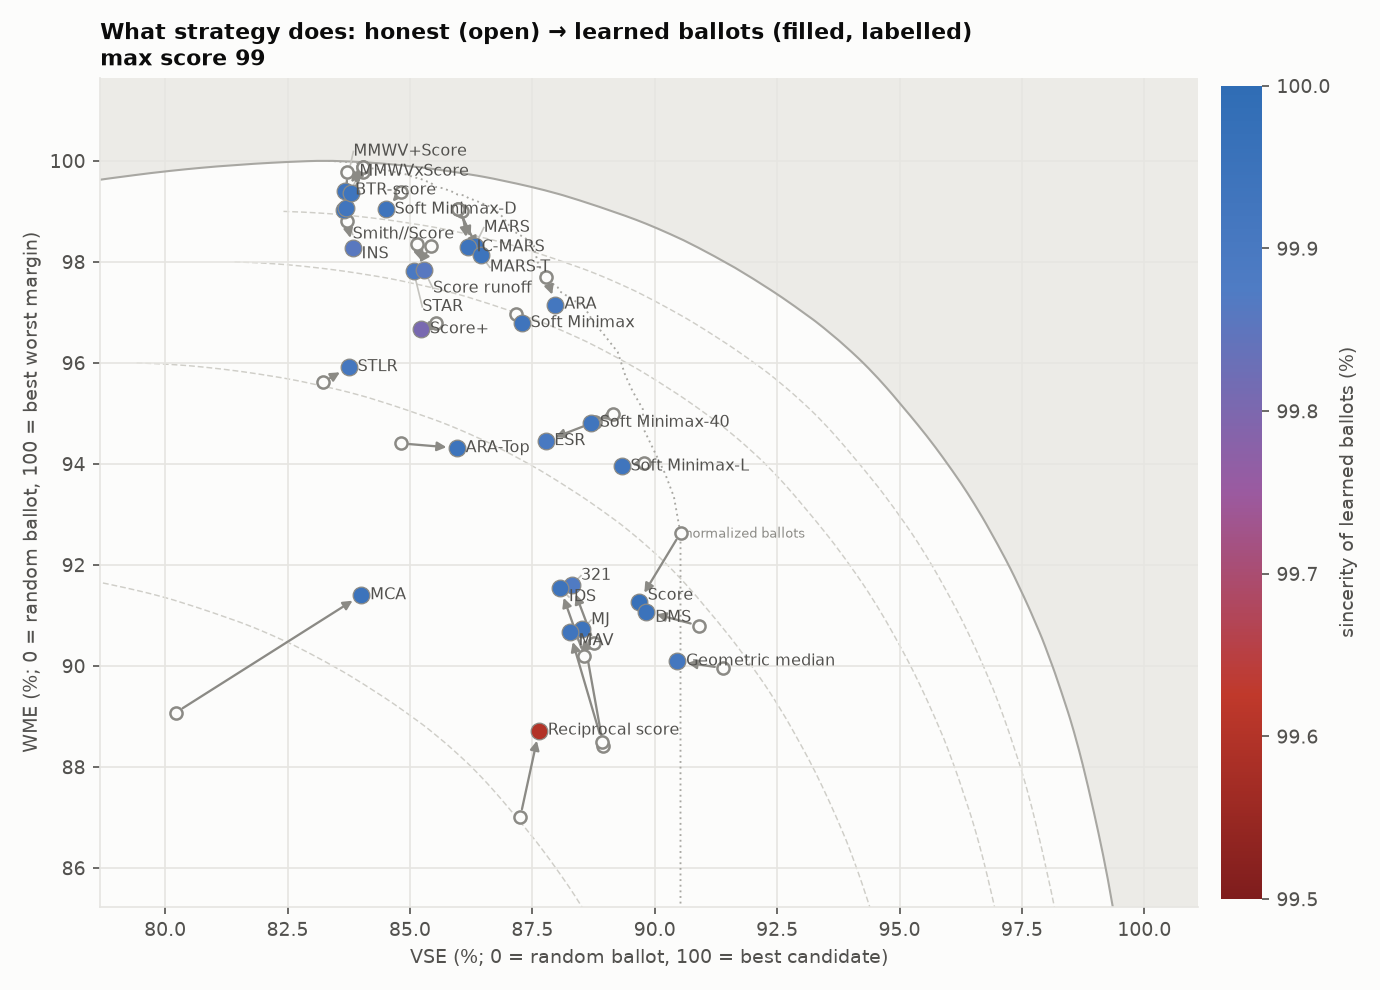
The default assumptions used diverge in several ways from prior voting simulations (for process of how these were found see the journal), but there are enough options that you can compare with other models. For example, I've run one test with settings close to vse-sim. You can try the command yourself (took me ~3h) and change settings one to see how these affect the results.
Metrics
The point is not to determine the single "best" voting method. Instead it looks at three different measures. The metrics are:
- Voter Satisfaction Efficiency (VSE) is a utility measure to compare how good the elected candidate is relative to the theoretically ideal (set to 100) and random ballot (set to 0). I choose to use random ballot instead of random candidate (as earlier VSE simulations do), to make the definition independent of the number of candidates (see strategic nomination below) and also to stretch the scale a bit (factor ~1.61) to make it more readable. It's not about the absolute values anyway, but about the relations between methods.
- Worst-Margin Efficiency (WME) serves as a Condorcet measure: the winner's worst head-to-head margin against any rival. Using margins makes it a continuous value instead of % of times a CW is elected. It therefore can also cover cases in which no CW exist and weakens the impact of cases where the CW only exist by a small number of votes. Again, it is scaled to 100 for best and 0 for random ballot.
I see this mostly as the "legitimacy measure". Which means, that when A wins as score winner, but 60% of voters prefer B, then they might question the legitimacy of the result after the election.
- Sincerity compares the submitted strategic ballot of a voter with the honest preference (not ballot), where every inversion of preferences counts as insincere, weighted by the strength of the preference. Here identity with the honest preference order is 100% and identity with a inverted ballot ("maximally dishonest") is 0.
This does not penalize information lost when the ballot forces, or allows for, collapsing information in e.g. approval voting or ranked methods with equal rankings allowed. For this a secondary measure of fidelity is used.
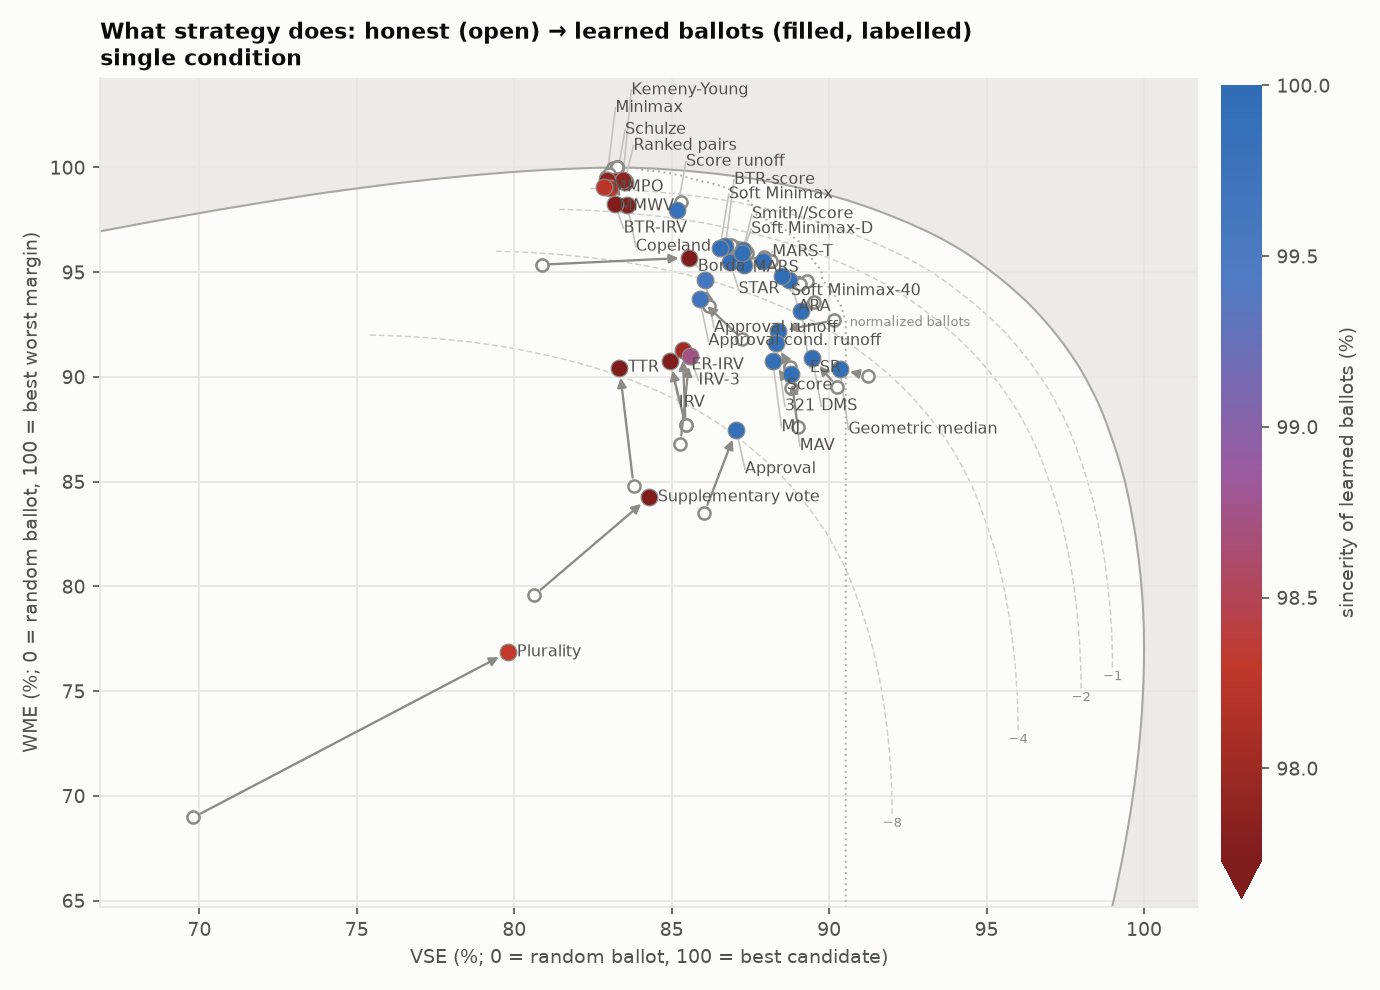
You can't max all these metrics at the same time. Since Condorcet winner and utility winner can differ, there is a theoretical limit (shown as gray region in the point plots) to how good a method can perform at both.
This means that there is a tradeoff between these qualities that applies to the voting methods. Where CW and utility winner differ, electing either loses points on the other metric. The set of best methods sits on a Pareto front of these metrics.
For rated ballots, it is an obvious assumption to make that voters will normalize their ballots to make use of the full range. For this those methods will fall short of reaching the ideal VSE. For this an additional dotted line labelled "normalized ballots" is shown. This is the theoretical maximum when respecting normalized ballots. The good methods are already very close to this limit as this example shows.
Deciding between these which one is "better" would require additional constraints.
Speaking of constraints; What the simulation misses completely is how complicated a given voting method is, and how practical it is to implement in the world. You could invent a method that does extremely well on all of the above metrics but still be essentially garbage, because it requires NP-hard calculation and a dense 4 hour lecture to explain how it works. As a counter example, approval voting and approval with runoff are still on my mental list of best reform options because they do well for being among the simplest methods (approval with runoff is close to the front, plain approval somewhat behind it). The problem is that I don't have an objective measure of how "simple" a voting method is yet.
There are also several other effects worth considering, such as the incentive to appeal to voters of the opposing side, but most such good qualities seem to be correlated for the most part.
Models
- Noise: A simple fractal noise (similar to Perlin noise) over the voting space. This requires the least number of assumptions. And it naturally produces a distribution that is neither too clumpy nor too uniform.
- Clusters: This first attempt at a model was a simplified version of what Chris Smith describes in his [blog post](Simulating Elections with Spatial Voter Models | by Chris Smith | Medium). It uses a spatial model (voters as points in a space) across dimensions. The influence of these dimensions degrades with
1/d (Zipf's law) to model that there is a order to how relevant various issues are perceived in the public. Within this space, voters are distributed in clusters under Gaussian distribution. The first implementation was too clumpy and had large gaps between clusters. This made the electorate too hard and separated CW from the utility winner. Under analysis it turned out that the cluster approach already creates something similar to a Zipf like distribution, so adding it on top doubled it. Therefore the defaults are without the Zipf law, but it can be turned on if needed.
- Field: Scale-free opinion fields.
- KS: Is the model of the vse-sim, which in the original code is called the "kitchen sink" model. It is available in a version with a few changes and as in vse-sim's code.
Candidates are drawn from the same space as voters. But there are options to shift and scale the candidate distribution, to model selection bias.
However, under reasonable assumptions, the same group of methods stays on the front, though the order within it shifts.
Various Settings
Apart from the basic settings of numbers of voters and candidates and model parameters, there are several settings regarding strategy and voter behaviour.
- By default there is a distribution over how much dissatisfaction voters will endure before they strategize ("adaptive"), with options to set always strategic voters ("strategic") and always honest (the rest).
- Another option determines how many voters will always vote strategic if it does not hurt ("aggressive") versus only vote strategic if it pays off ("kind").
- The lazy option makes voters truncate their ballots. But as a strategic option, truncation is always possible.
- The participation option tests if abstaining from the election would pay.
- The manipulation option checks how susceptible the method is to one sided strategy and how much counter strategy repairs.
- Strategic nomination is tested with the option to allow candidates to exit the race, or run clones.
- Rated ballots have a default range of 0 to 5, which can also be changed by a global setting.
Voting Methods
There are quite a lot of methods (not all of them serious, some only as theoretical reference), but if you are missing one of your favorites, then please tell me.
The default settings and most tests include the following 29 as standard comparison: Plurality, IRV, Borda, Approval, Score, STAR, MJ, MAV, 321, Ranked pairs, Schulze, TTR, Supplementary vote, ER-IRV (equal ranked IRV), IRV-3, Approval runoff, Approval cond. runoff, Copeland, Kemeny-Young, Minimax, MMWV, MMPO, BTR-IRV, Score runoff, MARS, ARA, BTR-score, Smith//Score and Soft Minimax-D
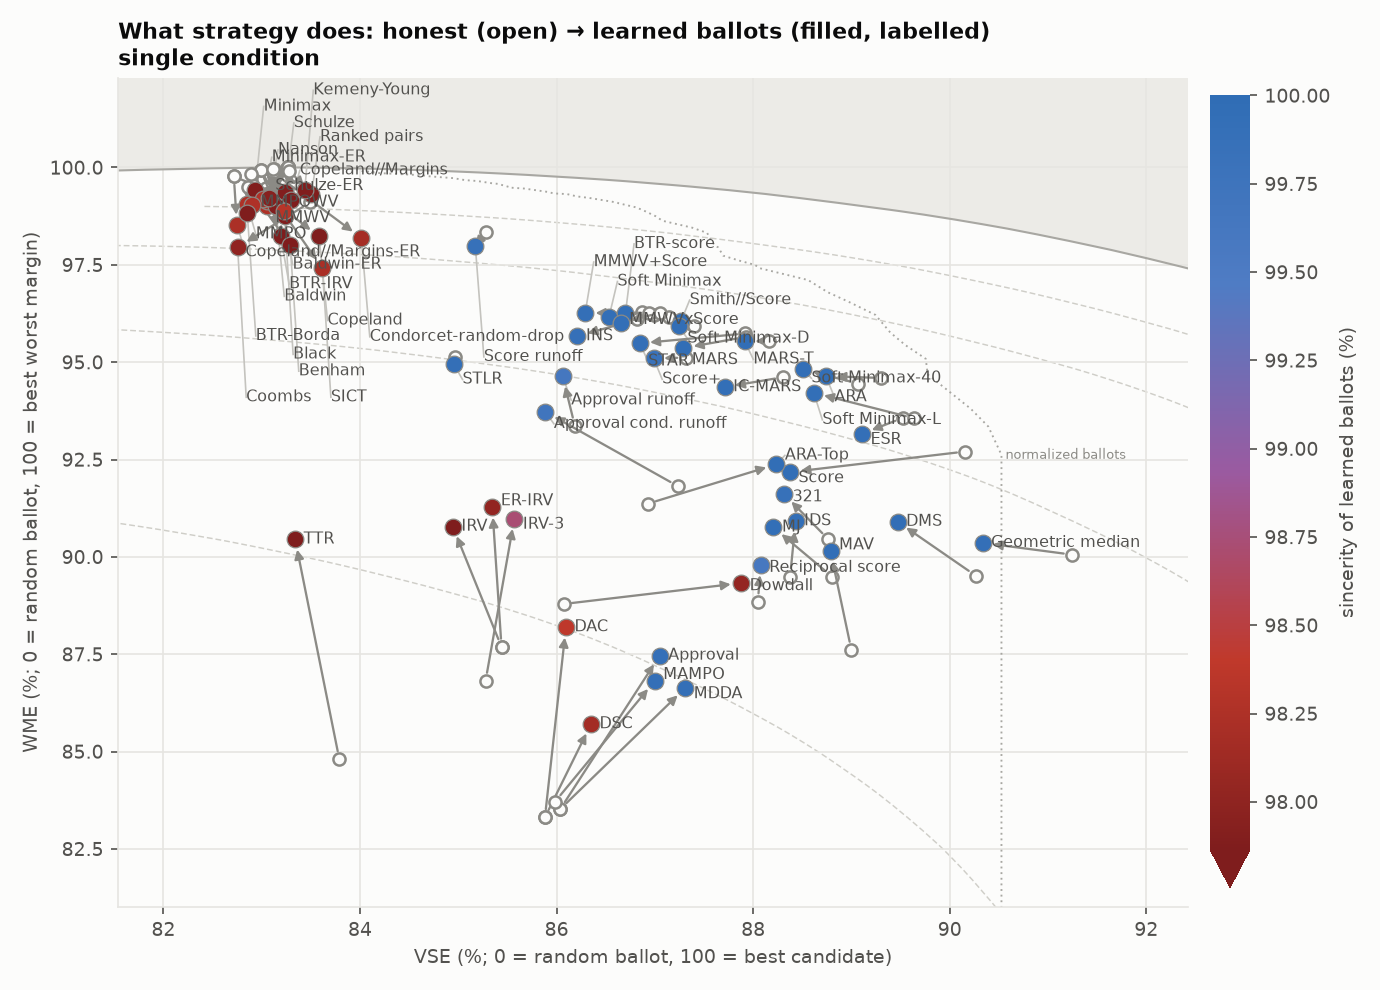
Here is a plot with the large set, only excluding some to get a zoomed in view.
There are also some methods that have been added here that are new for the most part:
Approval cond. runoff is a test in between plain approval and approval with obligatory runoff. Here in Germany we have TTR in almost all single winner elections, and people are married to the idea that the winner has to have more than 50% of the votes, but also don't like holding two elections every time. So I wondered if Approval voting with a conditional runoff would work, to only hold a runoff if no candidate has over 50% approval. The results show it consistently performing better than plain approval as well as TTR. However, it can behave a bit strange as the threshold for the runoff can invite for strategic voting. Or at least, I haven't looked deeply enough to make conclusions.
Soft Minimax and the variant Soft Minimax-D were invented in the process of making this simulation. They are therefore fitted to the metrics rather than inspired by theory, so the results have to be taken with caution. I invited Claude to make up a voting method of its own, and it reasoned that Minimax and score are strong contenders, so a continuous interpolation should give good methods in between. This is done by a fixed cutoff in score. Votes above this cutoff are counted as votes for one candidate over the other, votes below are counted as score. This gave Soft Minimax with a 20% cutoff. I then reasoned that it might be improved by determining the cutoff per match from the difference in average score between both candidates (plus one point), which gives Soft Minimax-D, which in general does perform better.
ESR (expanded support runoff) is also a new addition that I came up with while working with these simulations. It's effectively a graded Bucklin system to serve as a filter (similar to the idea of a MAF) for a normalized score runoff. In particular, voters submit a score ballot, then one counts the scores for each level of depth, starting at the top, to see who does best on each level. I.e. on a scale 0-5, count the 5 rated first, then all 5 or 4 rated, then 5, 4, 3 and so on. The set of all candidates that perform best in this way enters the automated runoff (single member wins outright). The runoff is by normalized score (but BTR-score or MARS would also be reasonable).
DMS is a similar idea to ESR. Recording the performance of each candidate at each level of depth and then minimaxing to find the candidate who's worst performance at any level is best.
TRASH is, as the name implies, the very best... Actually, I invented it to be worse than plurality voting and it really does succeed at this task.
Results
Since this is all fresh and there might still be some bugs or hidden false assumptions that influence the results, I don't want to look too closely at number of individual methods. But what can be observed clearly are general trends with various methods. Which make sense in hindsight.
Borda is the exception to pretty much everything I say here - it just behaves weird. And plurality is just bad in every way. The only methods worse are anti-plurality and TRASH (left out of the tests for this reason).
Condorcet methods are very robustly good under various assumptions. The supporters of the CW can almost always defend them with counter-strategy. Therefore they appear very strategic but hardly lose quality due to it.
Rated methods remain sincere. Since inversions of ranking have no use in ratings. Exaggeration does exist, but isn't as bad as one could expect. Score still scores above approval in both measures, so it doesn't fully devolve into approval voting.
Hybrid methods that combine Condorcet with ratings (Smith//Score, STAR, BTR-score, Soft Minimax-D, MARS, ARA) seem to inherit the robustness of the one and the honesty of the other. The best of both worlds, while also often performing better than a mere average between score and Condorcet would suggest.
A dedicated runoff improves methods a lot, but on the cost that a runoff has in real life (doubling the cost for the election, and often a lower turnout). Score runoff is the method that is undominated most often across all conditions. But, as one can reason, it suffers from the problem that the leading candidate can run a clone and then nullify the use of the runoff. So with strategic nomination turned on it becomes more like plain score. For a fair comparison it might be necessary to compare runoff methods in their own category.
However, this still implies that one of the simplest methods to explain is also one of the best performing. As a reform proposal this is a strong candidate. If someone then objects, for good reason, that the runoff has problems, then STAR comes to the rescue.
Since rated methods are inherently strategic, the assumptions that go into modeling the honest vote matters a lot. Strategy can repair some of it given enough time. For Condorcet methods and IRV, the honest vote is just a honest ranking. For rated, default ratings are 0 to 5. As the default runs also use 6 candidates, this means for hybrid methods means that they can't take full advantage of both the Condorcet property and score differences.
Currently it is assumed for the honest vote that voters submit a rating, normalized to min an max, instead of trying to take advantage of all ratings. These ties lose pairwise information, but are true to the utility preference. For this reason, increasing the max score makes them behave more like Condorcet methods. If one would model them to take advantage of the whole range, avoiding ties, then this would become a Condorcet-Borda hybrid, rather than score.
The reality is probably in between these two extremes, because the voters get to decide how to use their ballot. But this is why I actually do like the hybrid methods a lot. It allows for both, so voters can choose and use the strategic protection that comes from Condorcet methods when they need it.
Insight
I started making this just out of curiosity to see how various methods map onto two metrics like these. I didn't expect to find any satisfying answer. As expected there is no single best voting method dropping out of this. However a higher level insight still feels like satisfying conclusion. The dotted line labeled "normalized ballots" was added after that insight and confirmed it.
You see, while I was plotting these methods under various conditions and inventing and trying new ones, it became apparent that they were approaching a limit that is below the theoretical VSE limit, but still roughly following the shape. I wondered why the methods can hardly improve beyond the current front and the answer is actually quite simple: VSE is measured in terms of absolute utility, while the honest ballots are normalized (each voter stretches their scores to their own range).
So this is a flaw in the model, but one that can not be removed without introducing a different bias. Strategy allows voters to regain that expressiveness, as each voter has one vote. The normalized line then shows the maximum VSE a method could attain if all voters use the most basic strategy of using their full vote. But methods still can occasionally pass beyond it when the votes aren't optimized to the maximum.
All in all this means that the limit is much lower than I originally thought. And looking at it, it becomes apparent that the current best methods all lie very close to that limit. Trying to improve upon them mostly results in tradeoffs and only gains a little. And even if an improvement in both values is possible, then it comes with added complexity (see e.g. the runoff methods).
With this I realized that the best voting methods we currently have are already close to as good as it gets. We are already hitting diminishing returns on the whole front. Within this model, there is no need to find any better methods. Instead, we can just look at the front and pick those that are practical, simple to explain and implement, or have some theoretic appeal.
This means that most of the voting methods that are discussed among experts are already at the Pareto front of ideal methods (except IRV and TTR, which are just worse, Borda, which is just weird, and plain approval, which is somewhat behind but very simple). There is a clear set of good methods which lie on that front. Picking those performing better in WME or VSE, in between, or by some theoretical argument is mostly a matter of taste. Either side can look better depending on the assumptions one puts into the model. Theoretical flaws, like being susceptible to the dark horse and three rivals scenario, or the chicken dilemma, seem to not influence the results much, at least in this model. Practically, all the "good" methods seem to be about equally good and there is no risk for implementing one rather than the other, as long as we replace the clearly bad voting methods we currently use almost everywhere.